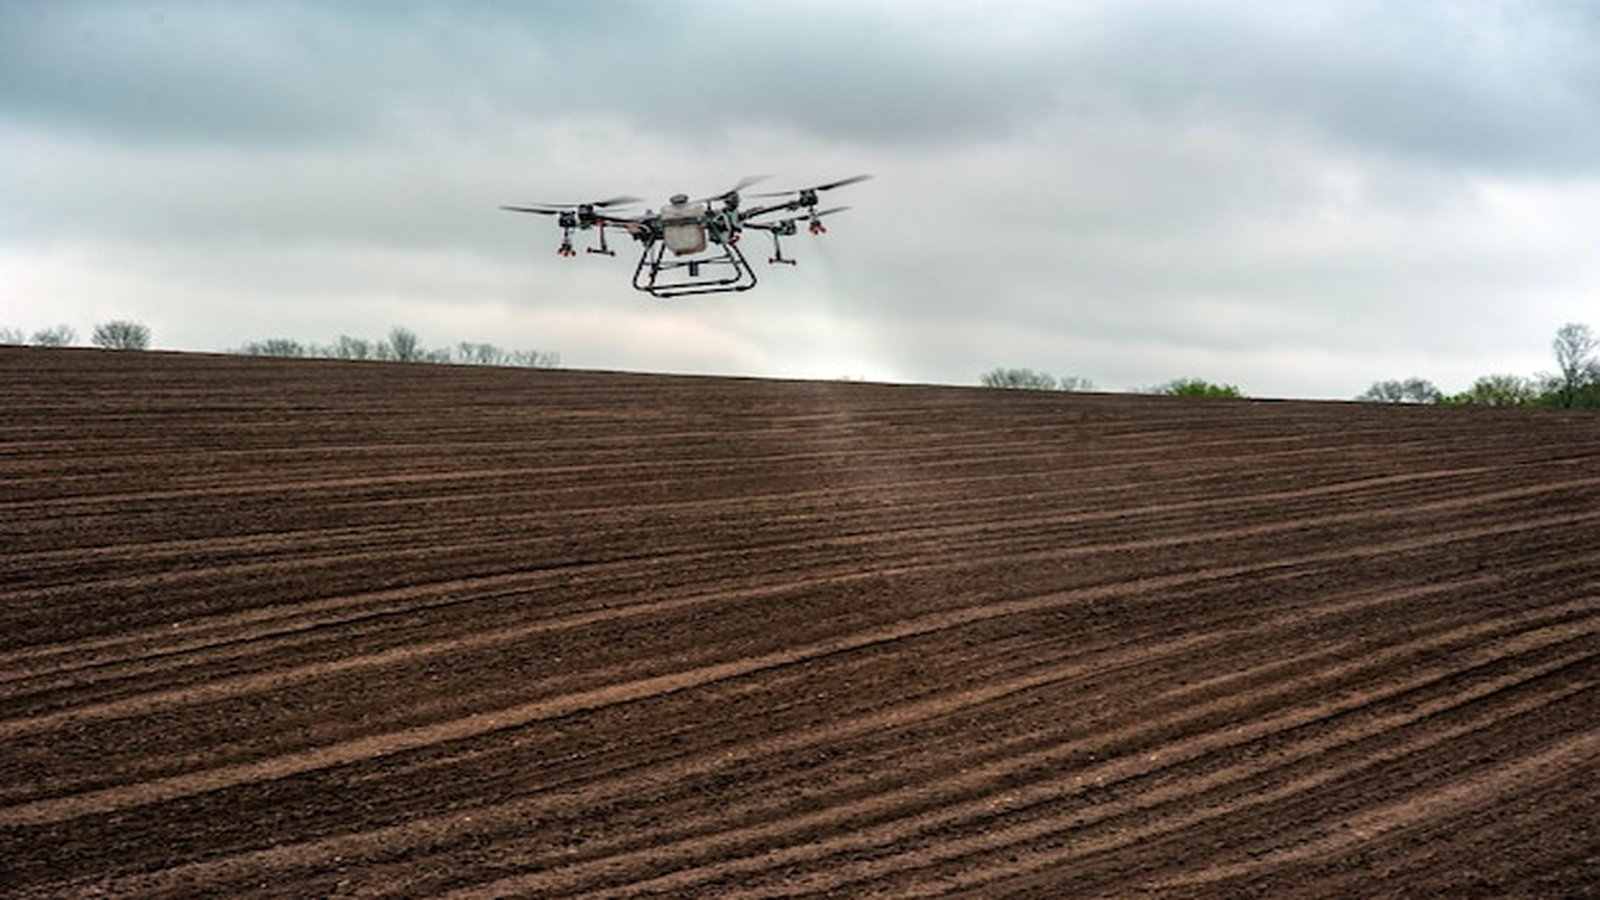
Precision application: drones, satellites and variable-rate technology for site-specific potassium-nitrate use
Variable-rate KNO₃ application guided by drones, satellite imagery and soil sensors is cutting input waste by up to 25% while maintaining or improving yields across diverse cropping systems.
Why uniform application rates are leaving value on the table
Most fields are not uniform. Soil texture, organic matter, drainage, pH and historical nutrient status vary across even a single paddock. Yet the majority of KNO₃ applications still go out at a flat rate. That means some zones get more than the crop can use while others remain underfed. The result is wasted input, uneven crop performance and unnecessary environmental risk.
Precision agriculture technology has matured enough that site-specific fertilizer management is now practical for mid-size and large operations, not just research stations. This article covers the main tools, how they apply to KNO₃ programs and what growers can realistically expect from adoption.
The precision application toolkit
Satellite and aerial imagery
Multispectral satellite imagery (from providers like Planet Labs, Sentinel-2 and commercial drones) reveals in-season crop variability through vegetation indices like NDVI and NDRE. These indices correlate with canopy vigor, nitrogen status and stress patterns.
For KNO₃ management, satellite data helps in two ways:
- Pre-season zone mapping: Historical imagery identifies consistent productivity zones that should receive different base fertilizer rates
- In-season adjustment: Real-time imagery during the growing season triggers variable-rate top-dress or fertigation adjustments
Soil sensing
Grid-based soil sampling (one sample per 0.5-1 ha) remains the most reliable way to map potassium availability across a field. Newer electromagnetic induction (EMI) sensors can map soil texture and moisture variability continuously at speed, creating high-resolution zone maps that correlate well with nutrient availability.
Soil EC (electrical conductivity) mapping is particularly useful for KNO₃ management because high-EC zones often indicate salinity or clay content differences that affect both potassium fixation and nitrate leaching risk.
Variable-rate application equipment
Modern spinner spreaders and fertigation controllers accept prescription maps that adjust application rate zone by zone. For granular KNO₃, GPS-guided variable-rate spreaders can change rate every few meters across the field. For fertigation, variable-rate injection paired with zone-specific drip or micro-sprinkler layouts delivers different concentrations to different management zones.
How variable-rate KNO₃ works in practice
Step 1: Build a zone map
Combine soil sampling data, yield maps from previous seasons and satellite imagery to divide the field into 3-5 management zones based on potassium status and yield potential.
Step 2: Set rate prescriptions
Assign KNO₃ rates to each zone based on soil-test K levels, target yield and crop removal estimates. High-K zones might receive 20-30% less than the field average, while low-K zones receive proportionally more.
Step 3: Generate application maps
Use farm management software (John Deere Operations Center, Climate FieldView, Trimble Ag Software or similar) to convert zone prescriptions into machine-readable application maps.
Step 4: Apply and monitor
Execute the variable-rate application and monitor in-season crop response via satellite imagery or tissue testing to verify that the prescription achieved the intended effect.
Real-world performance gains
Australian broadacre wheat
A grower cooperative in Western Australia implemented variable-rate KNO₃ top-dressing across 12,000 hectares of wheat. Using Sentinel-2 NDVI data and grid soil sampling:
- Total KNO₃ use decreased by 18% across the cooperative
- Average yield increased by 4% due to better allocation to responsive zones
- Return on the technology investment (sensors, software, equipment upgrades) was achieved within two seasons
California almonds
A 200-hectare almond operation in the San Joaquin Valley switched from uniform fertigation to zone-specific KNO₃ rates based on soil EC mapping and canopy NDVI:
- Potassium application uniformity (coefficient of variation) improved from 35% to 12%
- Nut yield increased 6% in previously under-fertilized zones
- Total K input remained the same, simply redistributed more effectively
Dutch greenhouse tomatoes
Even in highly controlled greenhouse environments, variable-rate fertigation of KNO₃ across different crop rows based on individual drain-water EC and nutrient analysis improved potassium use efficiency by 15% and reduced drain-water K concentrations, helping the operation meet tightening water-quality discharge limits.
Technology costs and ROI
| Technology | Approximate Cost | Typical Payback |
|---|---|---|
| Grid soil sampling (0.5 ha) | $8-15/ha per sampling round | Immediate if deficiencies identified |
| Satellite imagery subscription | $3-8/ha per season | 1-2 seasons |
| Soil EC mapping service | $15-25/ha (one-time) | 2-3 seasons |
| Variable-rate spreader upgrade | $5,000-15,000 | 2-4 seasons depending on area |
| VR fertigation controller | $3,000-8,000 | 1-3 seasons |
The economics are most favorable on larger operations and high-value crops where even small efficiency gains translate to significant dollar savings.
Integration with existing KNO₃ programs
Variable-rate technology does not require a fundamental change to your fertilizer program. It adds spatial precision to the same agronomic principles. If you are already using KNO₃ for its nitrate-form nitrogen advantages and chloride-free potassium supply, variable-rate application simply ensures those nutrients go where the crop needs them most.
For operations using foliar KNO₃ applications, drone-mounted multispectral cameras can identify canopy zones showing potassium or nitrogen stress symptoms before they are visible to the naked eye, allowing targeted foliar intervention rather than whole-field spraying.
What to do next
- Start with soil sampling and satellite imagery to understand your field variability
- Identify whether the variation is large enough to justify variable-rate management
- Begin with a single field or block as a proof of concept
- Measure results rigorously: compare variable-rate zones against a uniform-rate control strip
- Scale up progressively as confidence and equipment allow
For a wider view of how KNO₃ fits into modern nutrient management, visit our recommendations page.
FAQ
Do I need a new spreader for variable-rate KNO₃? Not necessarily. Many modern spreaders can be retrofitted with GPS receivers and variable-rate controllers at modest cost. Consult your equipment dealer for compatible options.
How accurate is satellite-based crop mapping for K management? Satellite imagery reliably identifies zones of different vigor, but it does not directly measure potassium status. Always ground-truth satellite data with soil or tissue samples before adjusting KNO₃ rates.
Is variable-rate application worth it on small farms? For farms under 50 hectares, the fixed technology costs may not justify the savings on a per-hectare basis. However, cooperative purchasing and shared service models can make it accessible for smaller operations.
Last updated: April 17, 2026
Related articles
Emerging ammonium-nitrate feedstocks: the fastest-growing raw material for potassium-nitrate fertilizers
New ammonia and nitric acid feedstock sources, from green hydrogen to captured CO₂ to waste-derived nitrogen, are reshaping the cost and sustainability profile of potassium nitrate production.
Read morePotassium chloride vs. potassium nitrate: raw-material trends and cost drivers in 2026
A practical comparison of KCl and KNO₃ as potassium sources, covering production costs, supply dynamics, agronomic trade-offs and the raw-material trends shaping pricing in 2026.
Read moreHaifa's FertiMatch system: AI-powered guidance for optimal potassium-nitrate application
Haifa Group's FertiMatch platform uses crop models and AI to generate tailored KNO₃ fertigation programs, showing strong results in commercial greenhouse and orchard operations.
Read more